Lab 9: Mapping
1. Objective
The main goal of this lab is to map out a static space. It can be used in future tasks. To do this, the robot need to be placed in different locations and spin around its axis while collecting the ToF readings.
2. Lab Tasks
2.1 Control
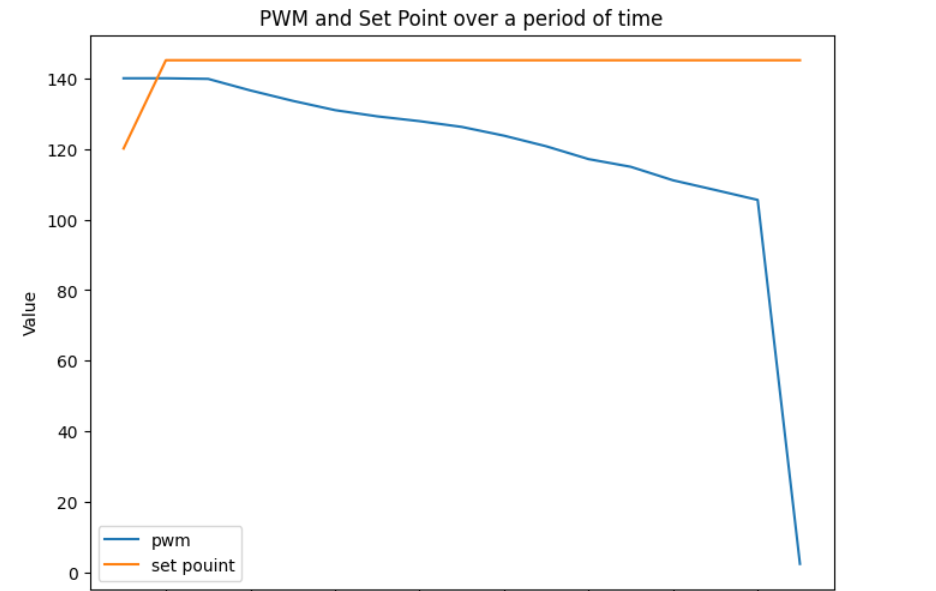
The method I choose is Orientation control. I use the orientation PID controller from the previous lab to achieve a 25 degree turn in each time. It has about 14 readings per 360 degree turn. Here is the output PWM after a new set point is set.
The video below the robot can turn on axis.
As I mentioned before, I used the DMP to get yaw. Therefore, there is little drift. Although each time the robot should turn 25 degree but sometimes it has about 5 degree bias. I will let it to rotate slightly more than 360 degree to ensure it can get enough data. When the robot is spinning, it will also have a 3 to 4 cm deviation from the origin. Here is the part of the code used in this lab.
     //turn 25 degree each time
        //map to -180 to 180

        float setPoint_imu = fmod(yaw + 25, 360);
        if (setPoint_imu > 180) {
            setPoint_imu -= 360;
        }
        //record the set point
        setpoint_array[count_turn360]=setPoint_imu;

        //
        while(input_PID_imu>170 && input_PID_imu<180){
          getnewIMU();
          change_speed(-125,125);

        }


        output_PID_imu=-20;
        // if the output_pid shows it has not finish turning (still large enough), it continue to turn this 25 degree
        while(output_PID_imu>10 || output_PID_imu<-10){
        getnewIMU();
        //read the data from imu to get yaw

        PID_forimu(Kp_imu,Ki_imu,Kd_imu,Imax_imu,minspeed_imu,setPoint_imu);
        change_speed(output_PID_imu,-output_PID_imu);

        }


        //wait one second to let it stable
        delay(1000);
        //read TOF data
        distanceSensor1.startRanging(); //Write configuration bytes to initiate measurement
        while (!distanceSensor1.checkForDataReady())
        {
          delay(1);
        }
        int distance_11 = distanceSensor1.getDistance(); //Get the result of the measurement from the sensor
        distanceSensor1.clearInterrupt();
        distanceSensor1.stopRanging();
        distance1_array[count_turn360]=distance_11;

        //wait for other one second to turn next time
        delay(1000);
2.2 Execute the turn in the designed lab space
I put my robot in each marked positions in the lab space and let it turn about 720 degree each time. Here is the code to generate the polar plot and one of the polar plot.
        # Open the file and read its content
        with open("outputlab9_5.txt", "r") as file:
            content = file.read()

        # extract the values
        distance5 = r"TOF1:(-?\d+(?:\.\d+)?)"
        yaw5 = r"Yaw:(-?\d+(?:\.\d+)?)"


        # Find all matched data and convert them to floats
        distance_array5 = [float(match) for match in re.findall(distance5, content)]
        yaw_array5 = [float(match) for match in re.findall(yaw5, content)]

        distance_array5=np.array(distance_array5)
        yaw_array5=np.array(yaw_array5)

        radians_array5 = yaw_array5 * (np.pi / 180)

        # establish polar plot
        plt.figure()
        ax = plt.subplot(111, polar=True)

        # plot
        ax.plot(radians_array5, distance_array5, marker='o')  # 使用'o'标记点


        plt.title('Polar Plot Example')


        plt.show()
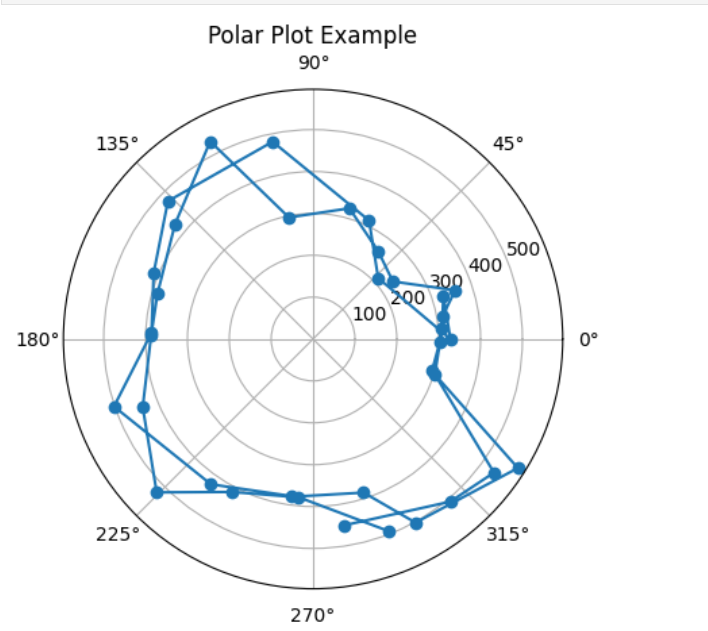
It can be observed that the returned distance is always smaller than 500 mm. However the actual distance is about 700mm. merge all polar plots and data we can get the measured points (by TOF) and the actual map (The blue points are measured data points and red lines represents the actual wall and box).
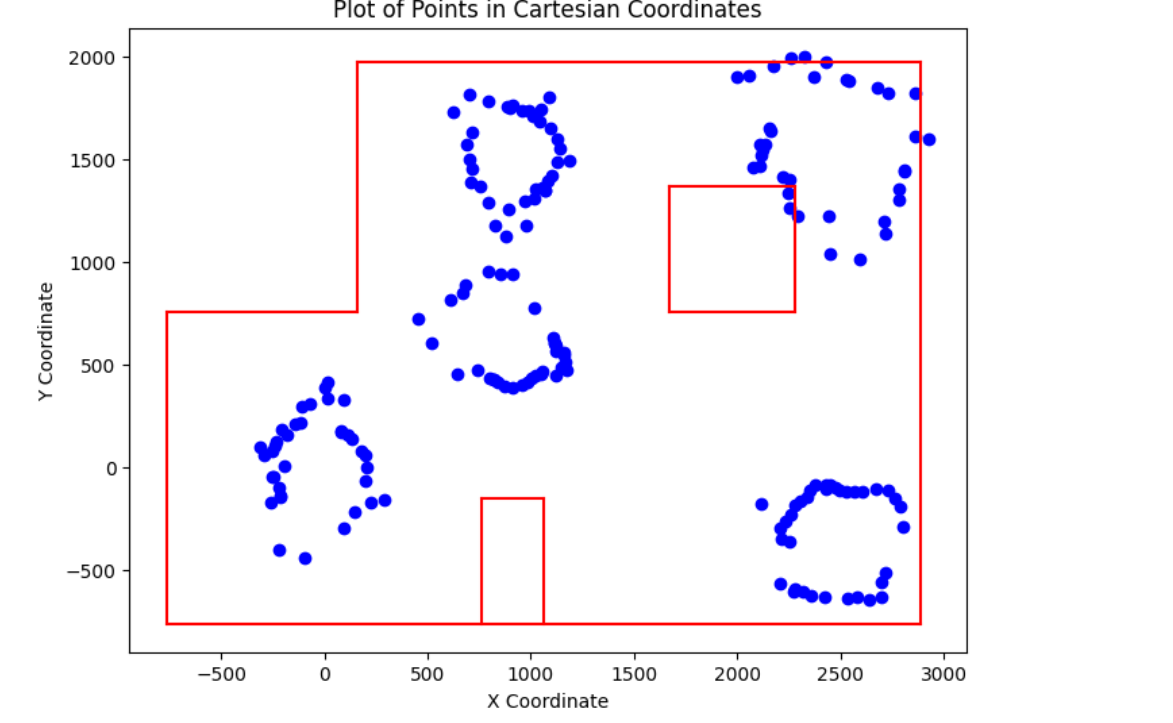
In the beginning, I believed it was the problem of TOF sensor. However, the sensor can return correct distance in other situations. I try to adjust the position of TOF sensor but it still return a very short distance. To verify the code is correct, I build a small lab space in Nils lab.
2.3 Execute the turn in the new lab space
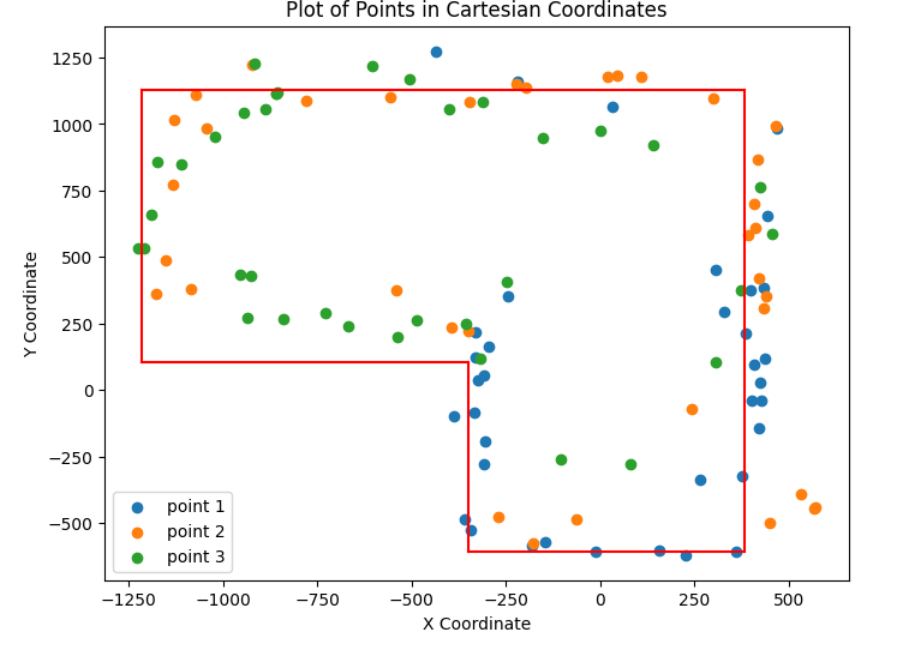
Here is the picture of this new environment which has 3 marked position.
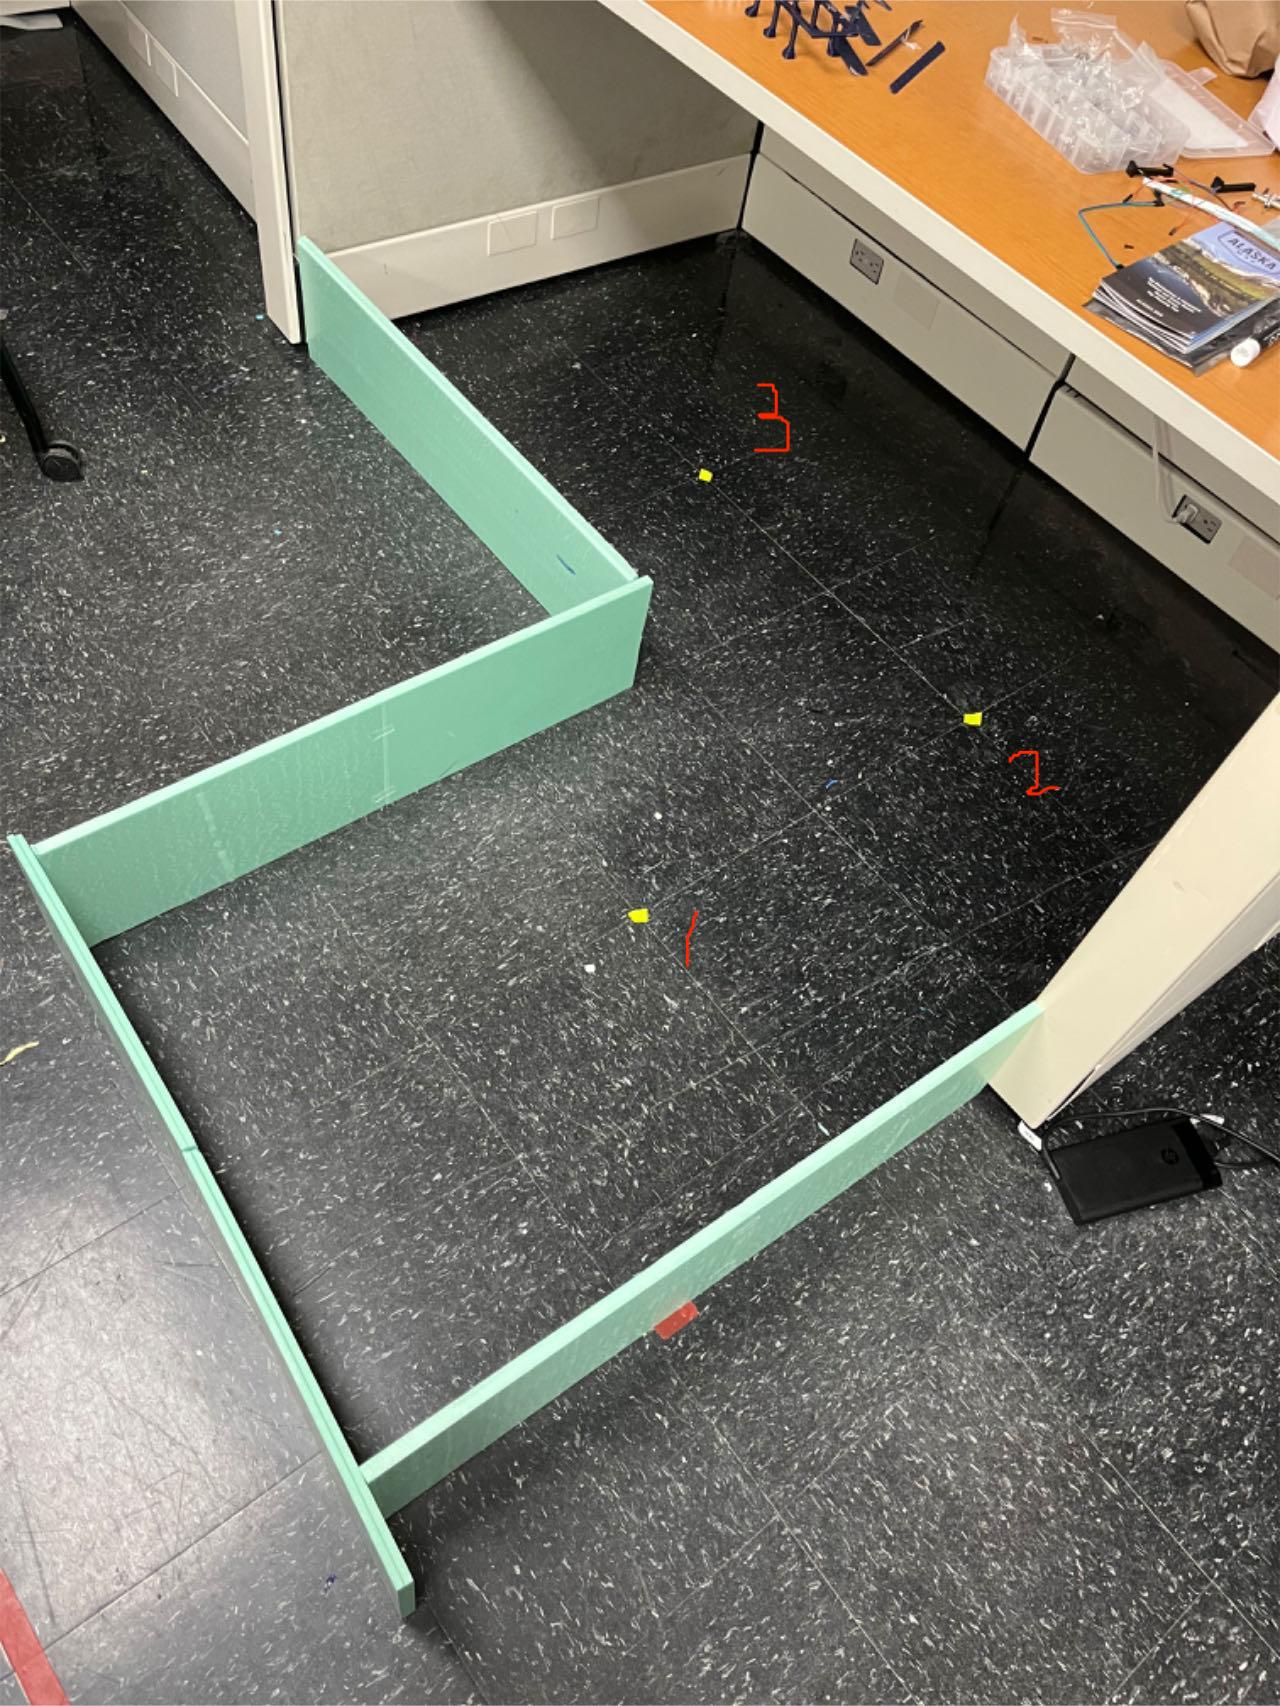
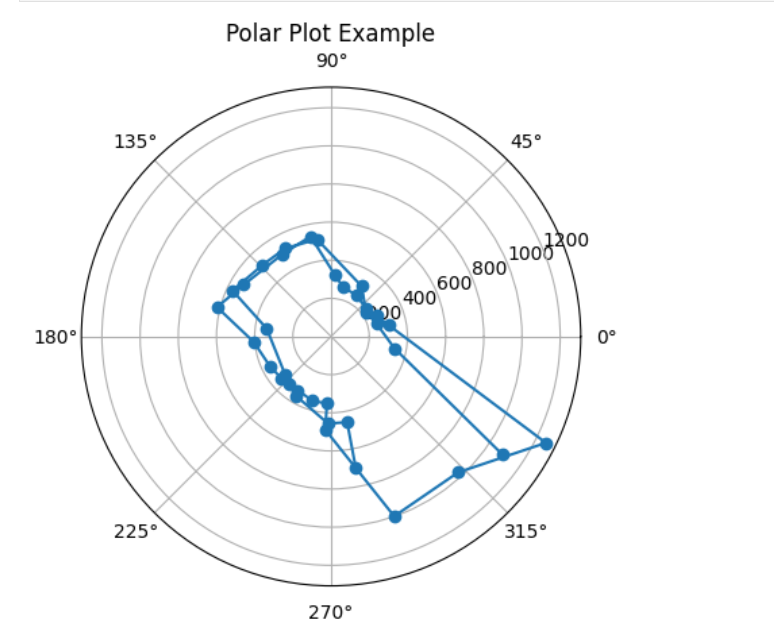
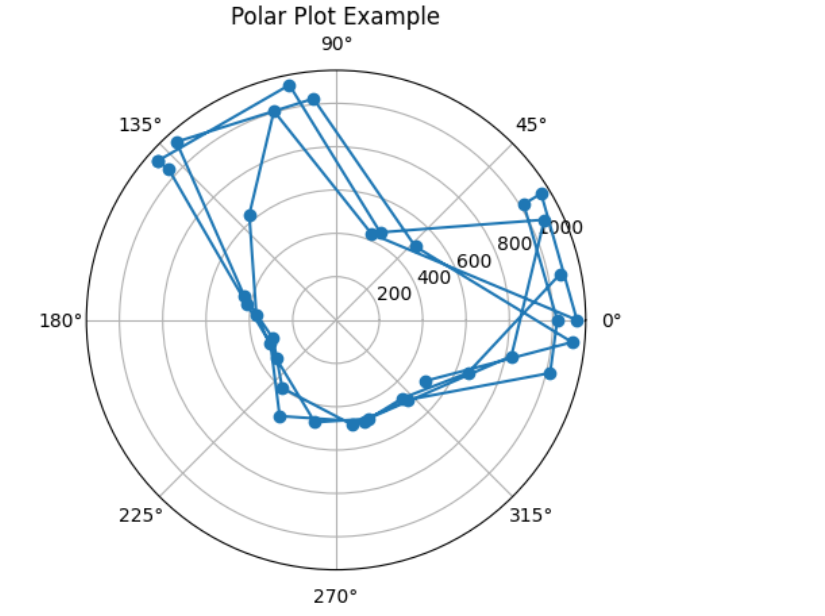
Following the previous code, I generate three polar plots at three marked points (marked as yellow point, can be observed on the previous image). The polar plots are shown below.
The polar plot of first point.
The polar plot of second point.
The polar plot of third point.
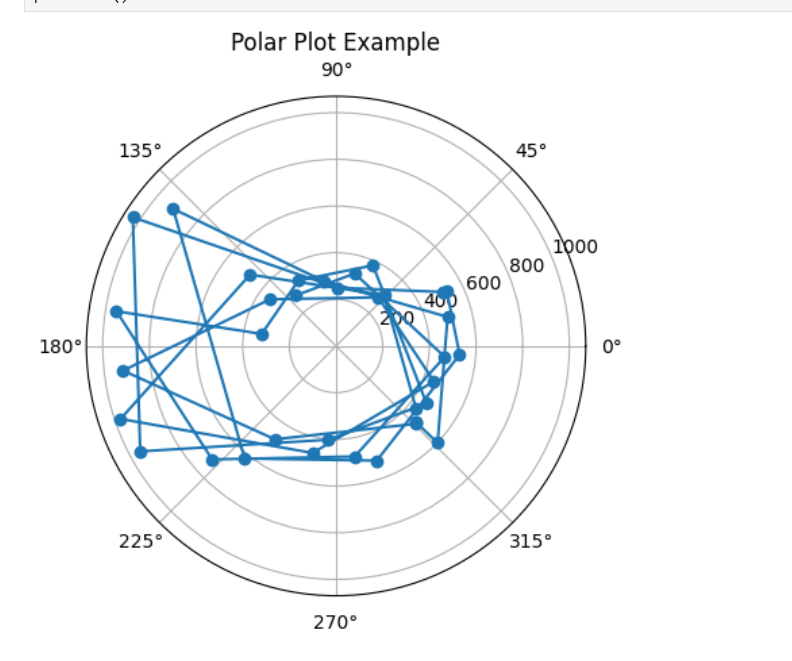
After that, I merge all my readings from the distance sensor to the inertial reference frame of the room and plot them. As all readings start from the same direction, I just need to map the first returned angle to a specific angle (such as 90 degree) and add the distance between TOF sensor to the center of robot in each readings, it will return the final plot. I also draw lines based on the scatter plot. It turns out that the result is similar to the ground truth.
